Google Shop Research
DataSet abstract:
| App | Category | Rating | Reviews | Size | Installs | Type | Price | Content Rating | Genres | Last Updated | Current Ver | Android Ver |
|---|---|---|---|---|---|---|---|---|---|---|---|---|
| Photo Editor & Candy Camera & Grid & ScrapBook | ART_AND_DESIGN | 4.1 | 159 | 19M | “10000+” | Free | 0 | Everyone | Art & Design | “January 7, 2018” | 1.0.0 | 4.0.3 and up |
| Coloring book moana | ART_AND_DESIGN | 3.9 | 967 | 14M | “500,000+” | Free | 0 | Everyone | Art & Design;Pretend Play | “January 15, 2018” | 2.0.0 | 4.0.3 and up |
Tools:
- Python3
- numpy
- pandas
- seaborn
Steps:
- Data clean
- Plots generating
- Data analysis
data clean
The propose of data clean is to delete data that is null and does not make sense. For example, in Current Ver column, Public.Heal is used but makes nonsense for data analysis.
Also, Current Ver and Android Ver are strings of digits and dots. In order to make graph easily, I converted them to floating point by extracting the digits before and after 1st dot. For instance,
4.0.3 became 4.0. Similarly, since the sizes of apps are record in kb and mb, I converted them to kb in integer.
For instance, 14M was multiplied by 1024 and became 14336.
Some results are shown below
| Photo Editor & Candy Camera & Grid & ScrapBook | ART_AND_DESIGN | 4.1 | 159 | 19456.0 | 10000 | Free | 0.0 | Everyone | Art & Design | “January 7, 2018” | 1.0 | 4.0 |
| Coloring book moana | ART_AND_DESIGN | 3.9 | 967 | 14336.0 | 500000 | Free | 0.0 | Everyone | Art & Design;Pretend Play | “January 15, 2018” | 2.0 | 4.0 |
Plots generating & Data analysis
Pair plots
Since a rating shows users’ likeness, so I made a pair plot to see the differences between applications that is rated lower than 4.0 and applications that are rated higher than 4.0.
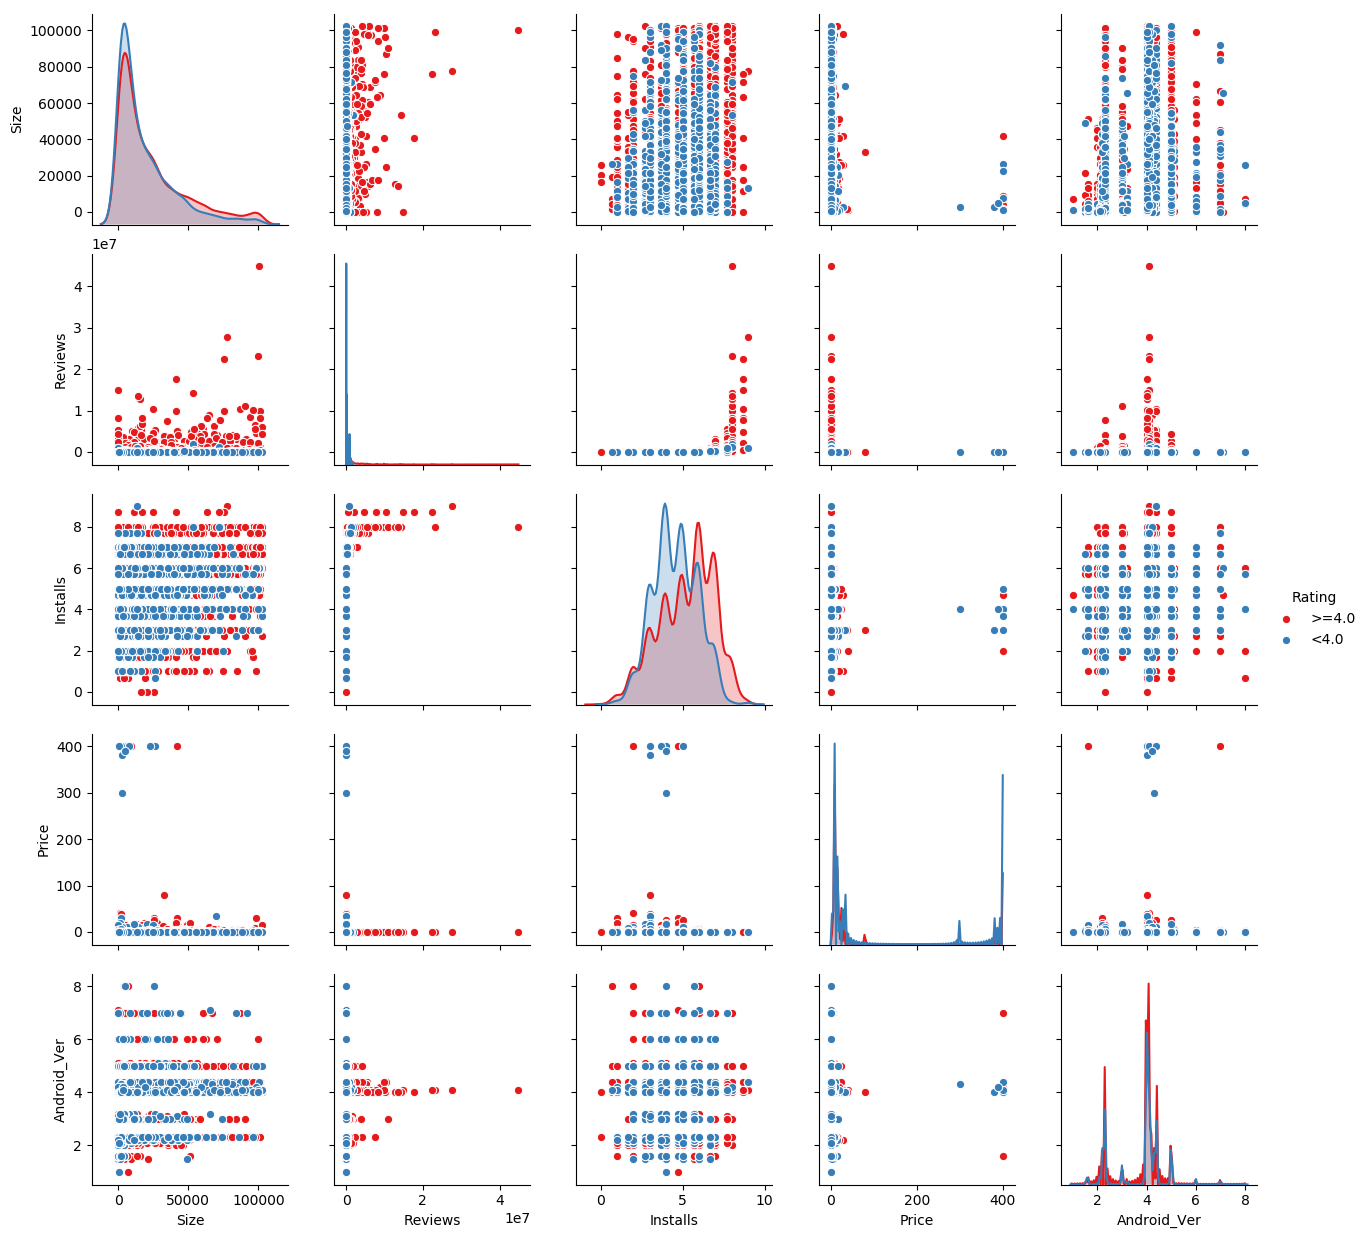 The most interesting plots are review vs price and review vs android version. The review vs price plot shows that high rated and high reviewed
applications are free applications. And, the review vs android version plot shows that applications that support lower android version usually get
more reviews, and their ratings are higher.
The most interesting plots are review vs price and review vs android version. The review vs price plot shows that high rated and high reviewed
applications are free applications. And, the review vs android version plot shows that applications that support lower android version usually get
more reviews, and their ratings are higher.
Range plot1
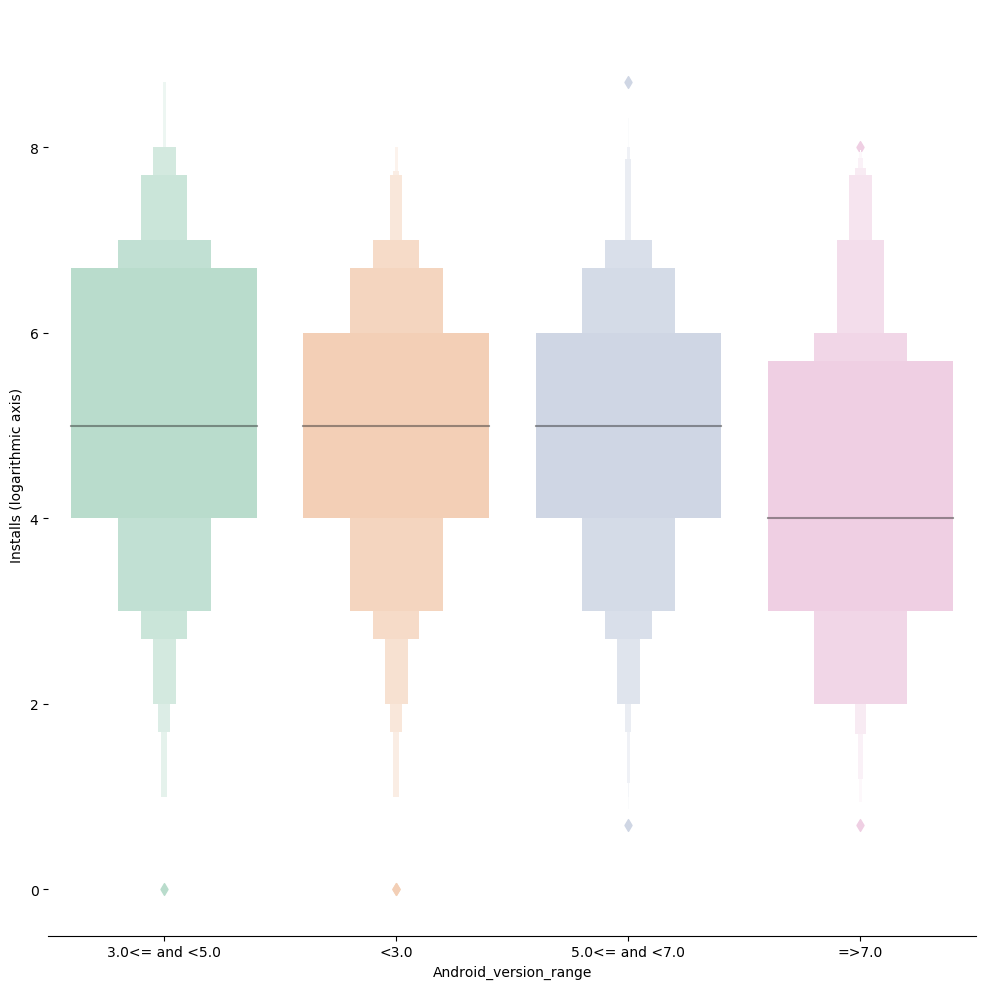
This is a installs vs android version range range plot. This shows applications that support on android version between 3.0 and 5.0 are more than any other groups. Considering the fact that when a application supports 4.0, it supports 7.0, supporting 3.0-4.0 looks like the minimum requirement for applications.
Range plot2
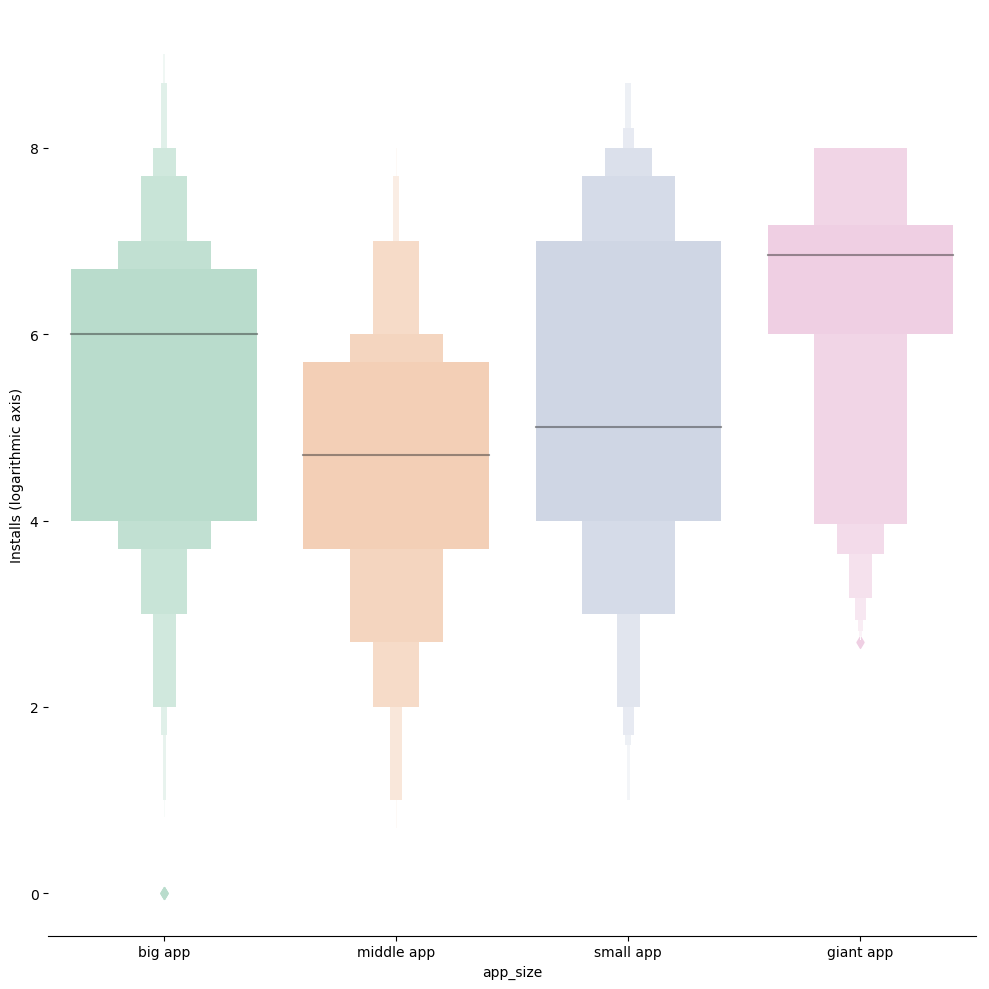
The definition is:
- small app: <1M
- middle app: 1MB<= and <10M
- big app: 10MB<= and <100M
- giant app: <=100M
It is actually surprising that many giant app are pretty popular. It may be because that many games are fall into that category and that new cellphones are getter bigger storage space to allow users to install apps that are <=100M.